Documentation Index Fetch the complete documentation index at: https://docs.agentkube.com/llms.txt
Use this file to discover all available pages before exploring further.
Agentkube supports extended tools that enhance your Kubernetes environment with specialized monitoring, security scanning, and operational capabilities. These tools require configuration and are stored per cluster in ~/.agentkube/additionalConfig.yaml.
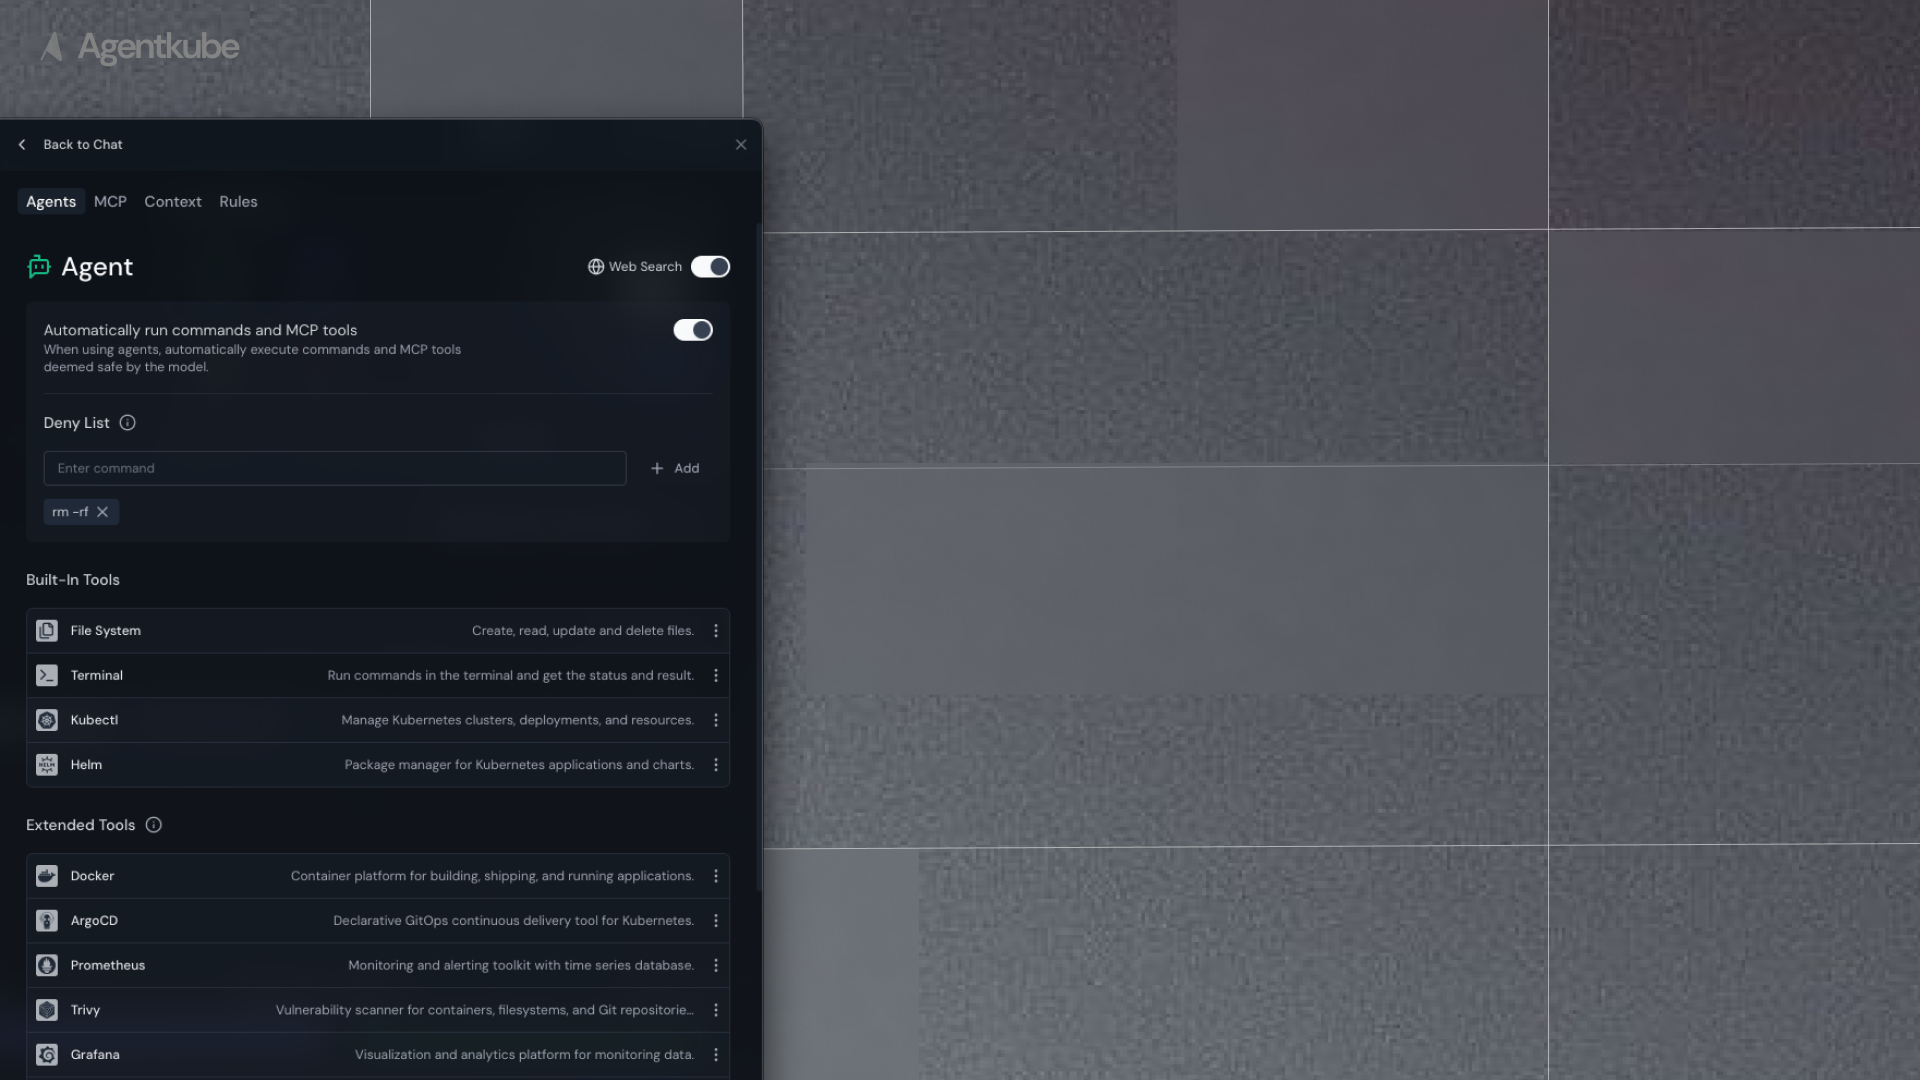
Configuration Management
Extended tools are configured per cluster context and stored in your ~/.agentkube/additionalConfig.yaml file. Each tool requires specific configuration parameters and can be enabled/disabled independently for each cluster.
Configuration Structure
cluster-name :
tool-name :
enabled : true/false
# tool-specific configuration parameters
Docker
Container platform for building, shipping, and running applications.
Show Configuration Parameters
Custom registry URL (defaults to Docker Hub)
Authentication endpoint for private registries
Registry username (optional)
Personal Access Token or password (optional)
ArgoCD
Declarative GitOps continuous delivery tool for Kubernetes.
Show Configuration Parameters
Internal Kubernetes service address (required)
External ArgoCD URL for browser access (optional)
ArgoCD authentication token (required)
Prometheus
Monitoring and alerting toolkit with time series database.
Show Configuration Parameters
Prometheus server URL (required)
Kubernetes namespace where Prometheus is deployed (required)
Internal service address for cluster access (optional)
Username and password for authentication (optional)
Bearer token for authentication (optional)
Trivy
Vulnerability scanner for containers, filesystems, and Git repositories.
Show Configuration Parameters
Trivy server URL (required)
Authentication token for Trivy server (optional)
Grafana
Visualization and analytics platform for monitoring data.
Show Configuration Parameters
Grafana server URL (required)
Grafana API key for authentication (required)
Username and password authentication (optional)
Datadog
Cloud monitoring platform for infrastructure, applications, and logs.
Show Configuration Parameters
Datadog API URL (defaults to US1 region)
Datadog API key (required)
Datadog application key (required)
Tempo
High-scale distributed tracing backend by Grafana.
Loki
Log aggregation system designed to store and query logs efficiently.
Alertmanager
Handles alerts sent by Prometheus server and routes them to receivers.
Show Configuration Parameters
Alertmanager server URL (required)
Authentication token (optional)
Username and password authentication (optional)
SigNoz
Open-source observability platform with APM, logs, and metrics.
Show Configuration Parameters
SigNoz server URL (required)
Authentication token (optional)
Username and password authentication (optional)
OpenCost
Real-time cost monitoring and optimization for Kubernetes.
Show Configuration Parameters
Internal Kubernetes service address (required)
Kubernetes namespace where OpenCost is deployed (required)
External OpenCost URL (optional)
Authentication token (optional)