Prerequisites
Monitoring in Agentkube currently requires the kube-prometheus-stack to be installed in your cluster. This stack provides Prometheus for metrics collection and Grafana for visualization.Support for other observability providers is planned for future releases.
Configuration
To enable monitoring in Agentkube, you need to configure the Prometheus service connection:Setting up Prometheus Connection
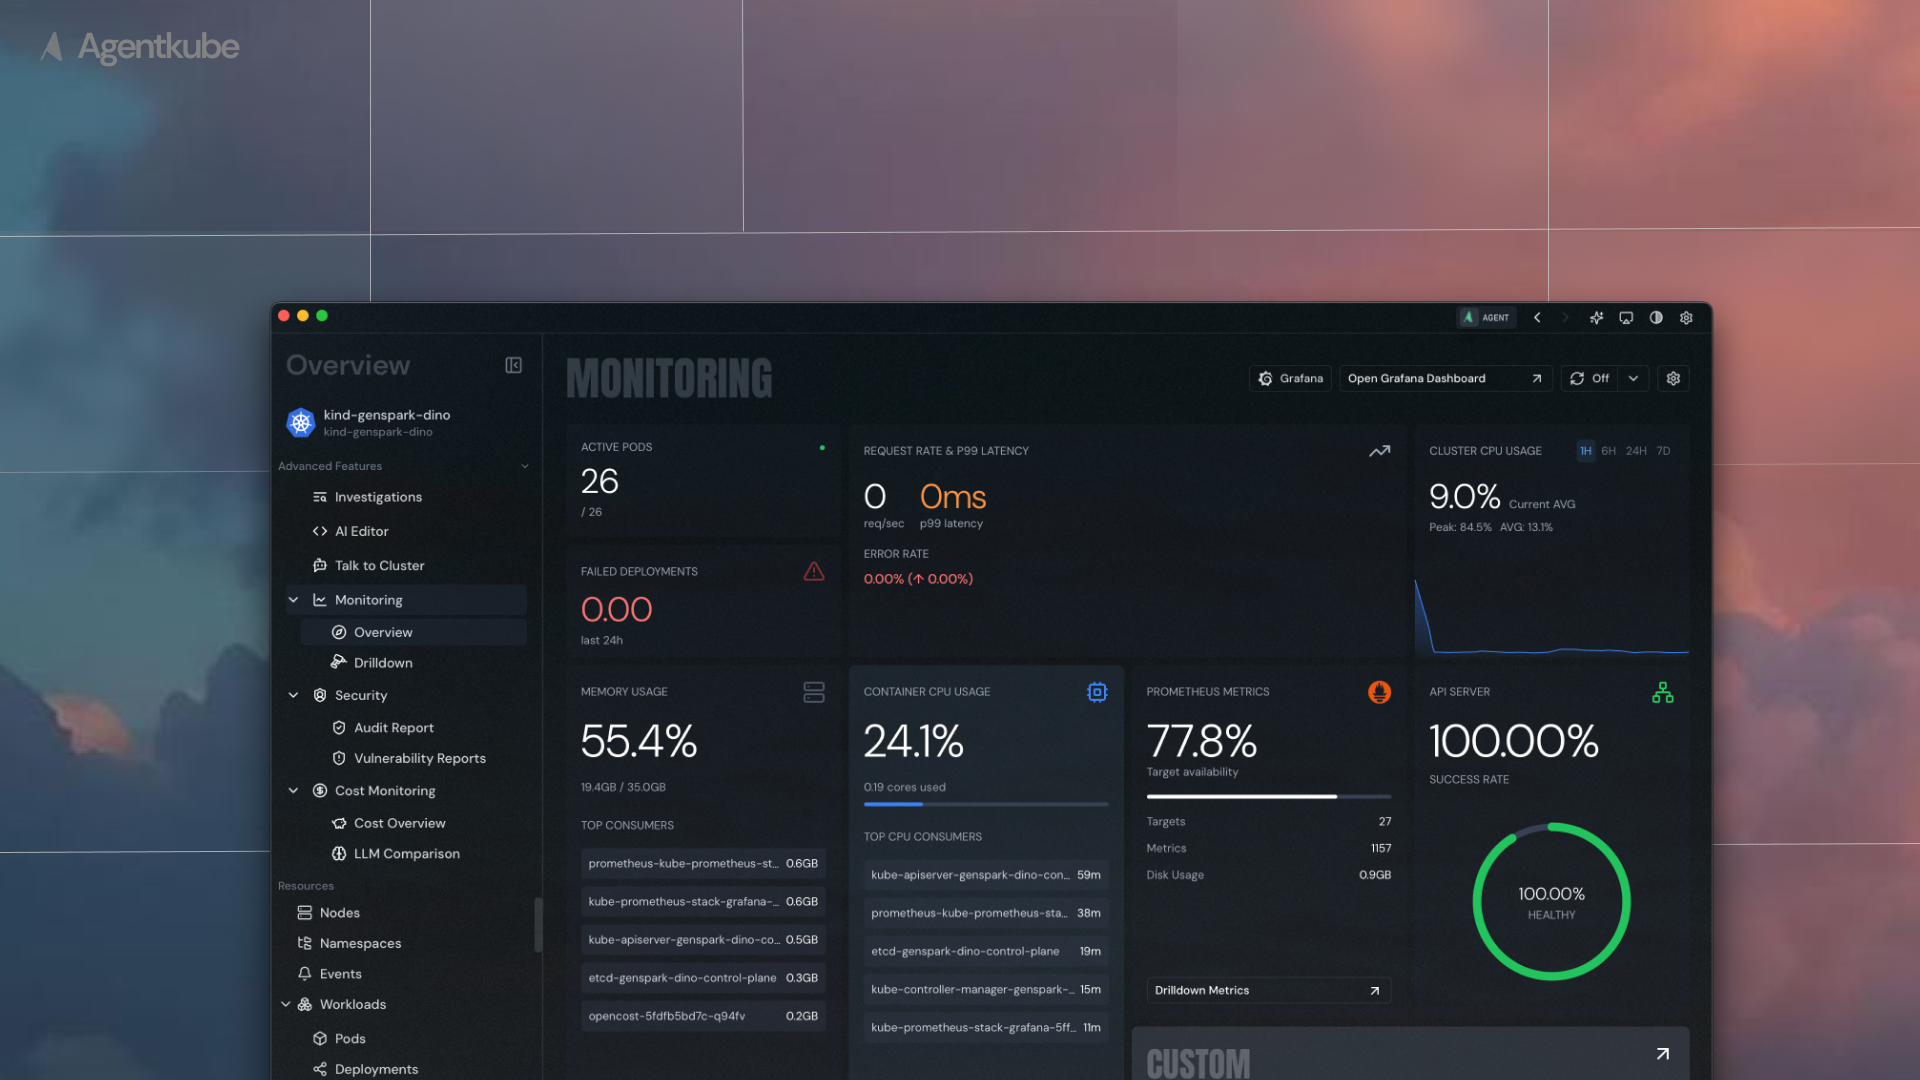
- Open Monitoring Page - Navigate to the Monitoring section in Agentkube
- Access Settings - Click the settings icon in the top right corner of the monitoring page
- Configure Prometheus - Provide the following required information:
- Prometheus Service Address: The URL endpoint of your Prometheus service
- Namespace: The Kubernetes namespace where Prometheus is deployed
Make sure your Prometheus service is accessible from Agentkube and that the service address is correctly formatted (e.g.,
prometheus-server:9090).